Cite this study
Everything on this page is machine-verified against published raw data (methodology and exports). Copy freely; attribution appreciated but not required. Updated Sep 15, 2026.
Verified statistics (copy any)
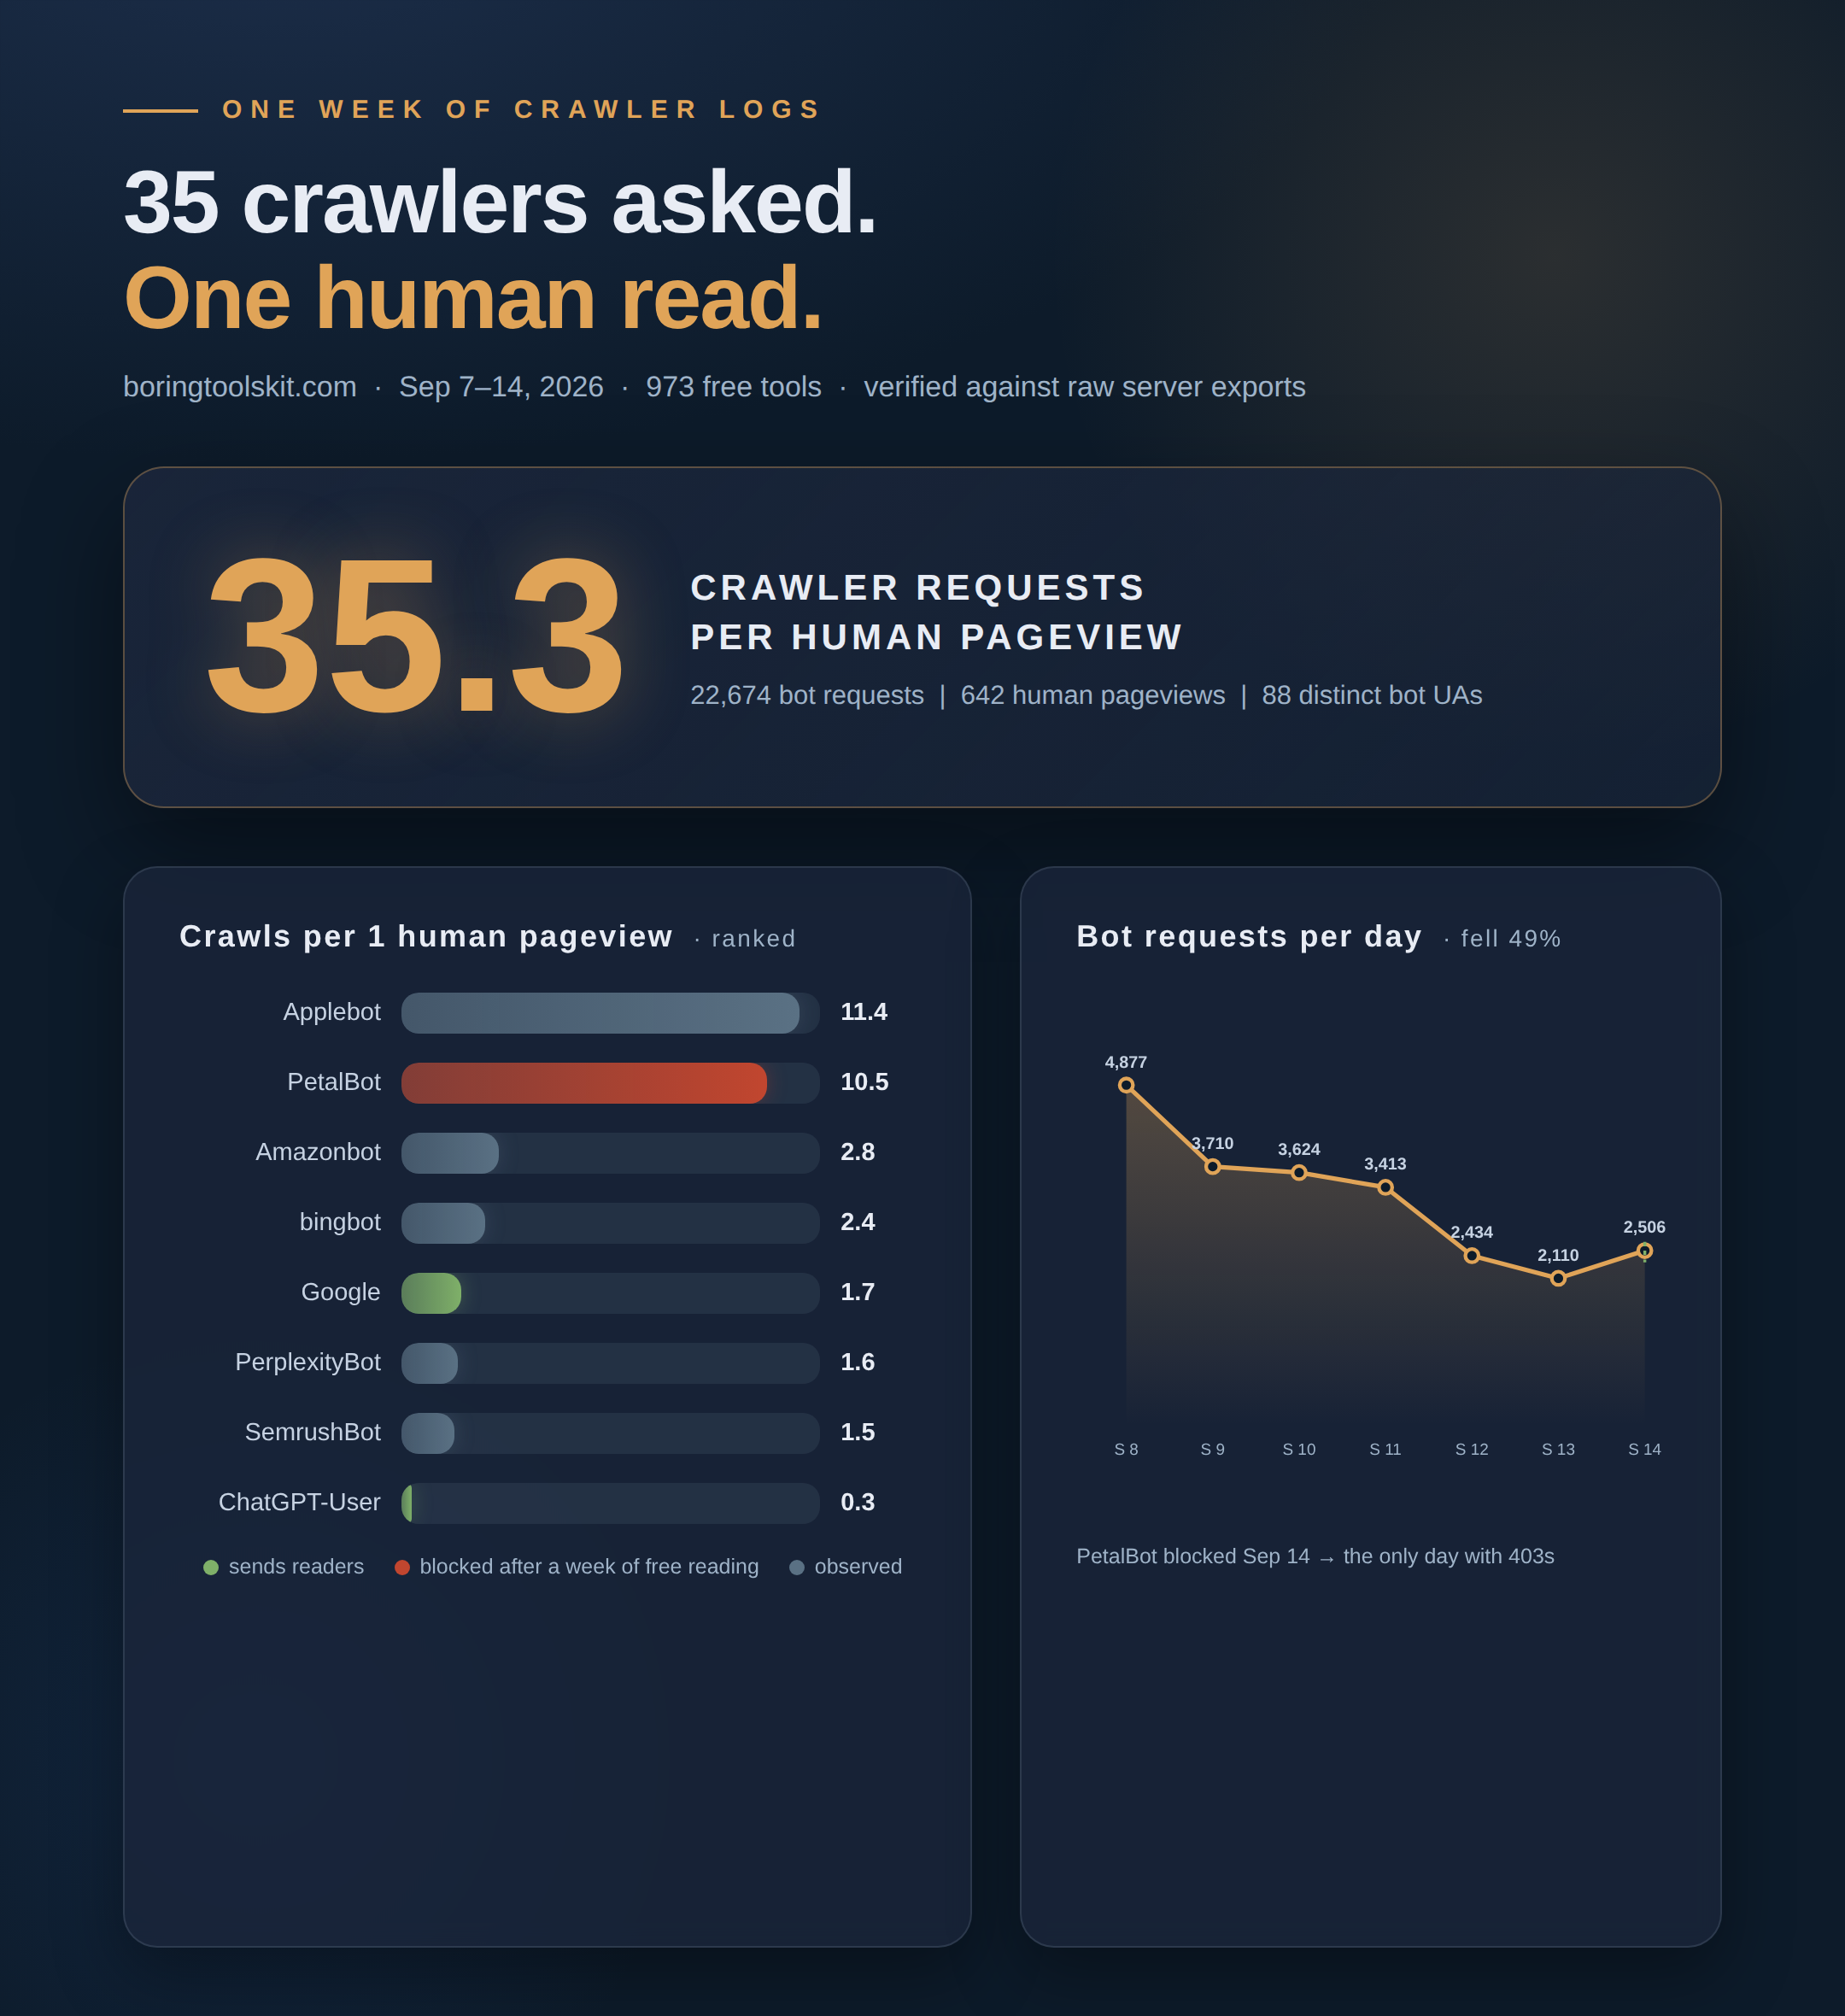
Over one week (Sep 7-14, 2026), the crawler-to-human ratio on a live 973-tool website was 35.3-to-1: 22,674 bot requests against 642 human pageviews.
29.4 percent of all requests to the site that week carried a bot user-agent (22,674 of 77,247 total requests).
Applebot was the #1 crawler by volume: 11.4 requests per human pageview (7,336 requests), while delivering zero recorded search visits to the site.
PetalBot made 6,719 requests (10.5 per human pageview), consuming 99.8 MB of bandwidth: roughly 1,000 pages a day for six days before the site firewall rule blocked it.
The entire Google crawler family (Googlebot, AdsBot, InspectionTool, StoreBot) made 1,100 requests: 1.7 per human pageview.
Amazonbot ran a complete one-week campaign (escalate, peak at 698 requests/day, decay) with zero refused requests, then departed.
ChatGPT-User, the only crawler that arrives via a real human expanding a link, made just 165 requests: 0.3 per human pageview.
Daily bot volume fell 49 percent across the week, from 4,877 requests on Sep 8 to 2,506 on Sep 14.
How to attribute
Assets
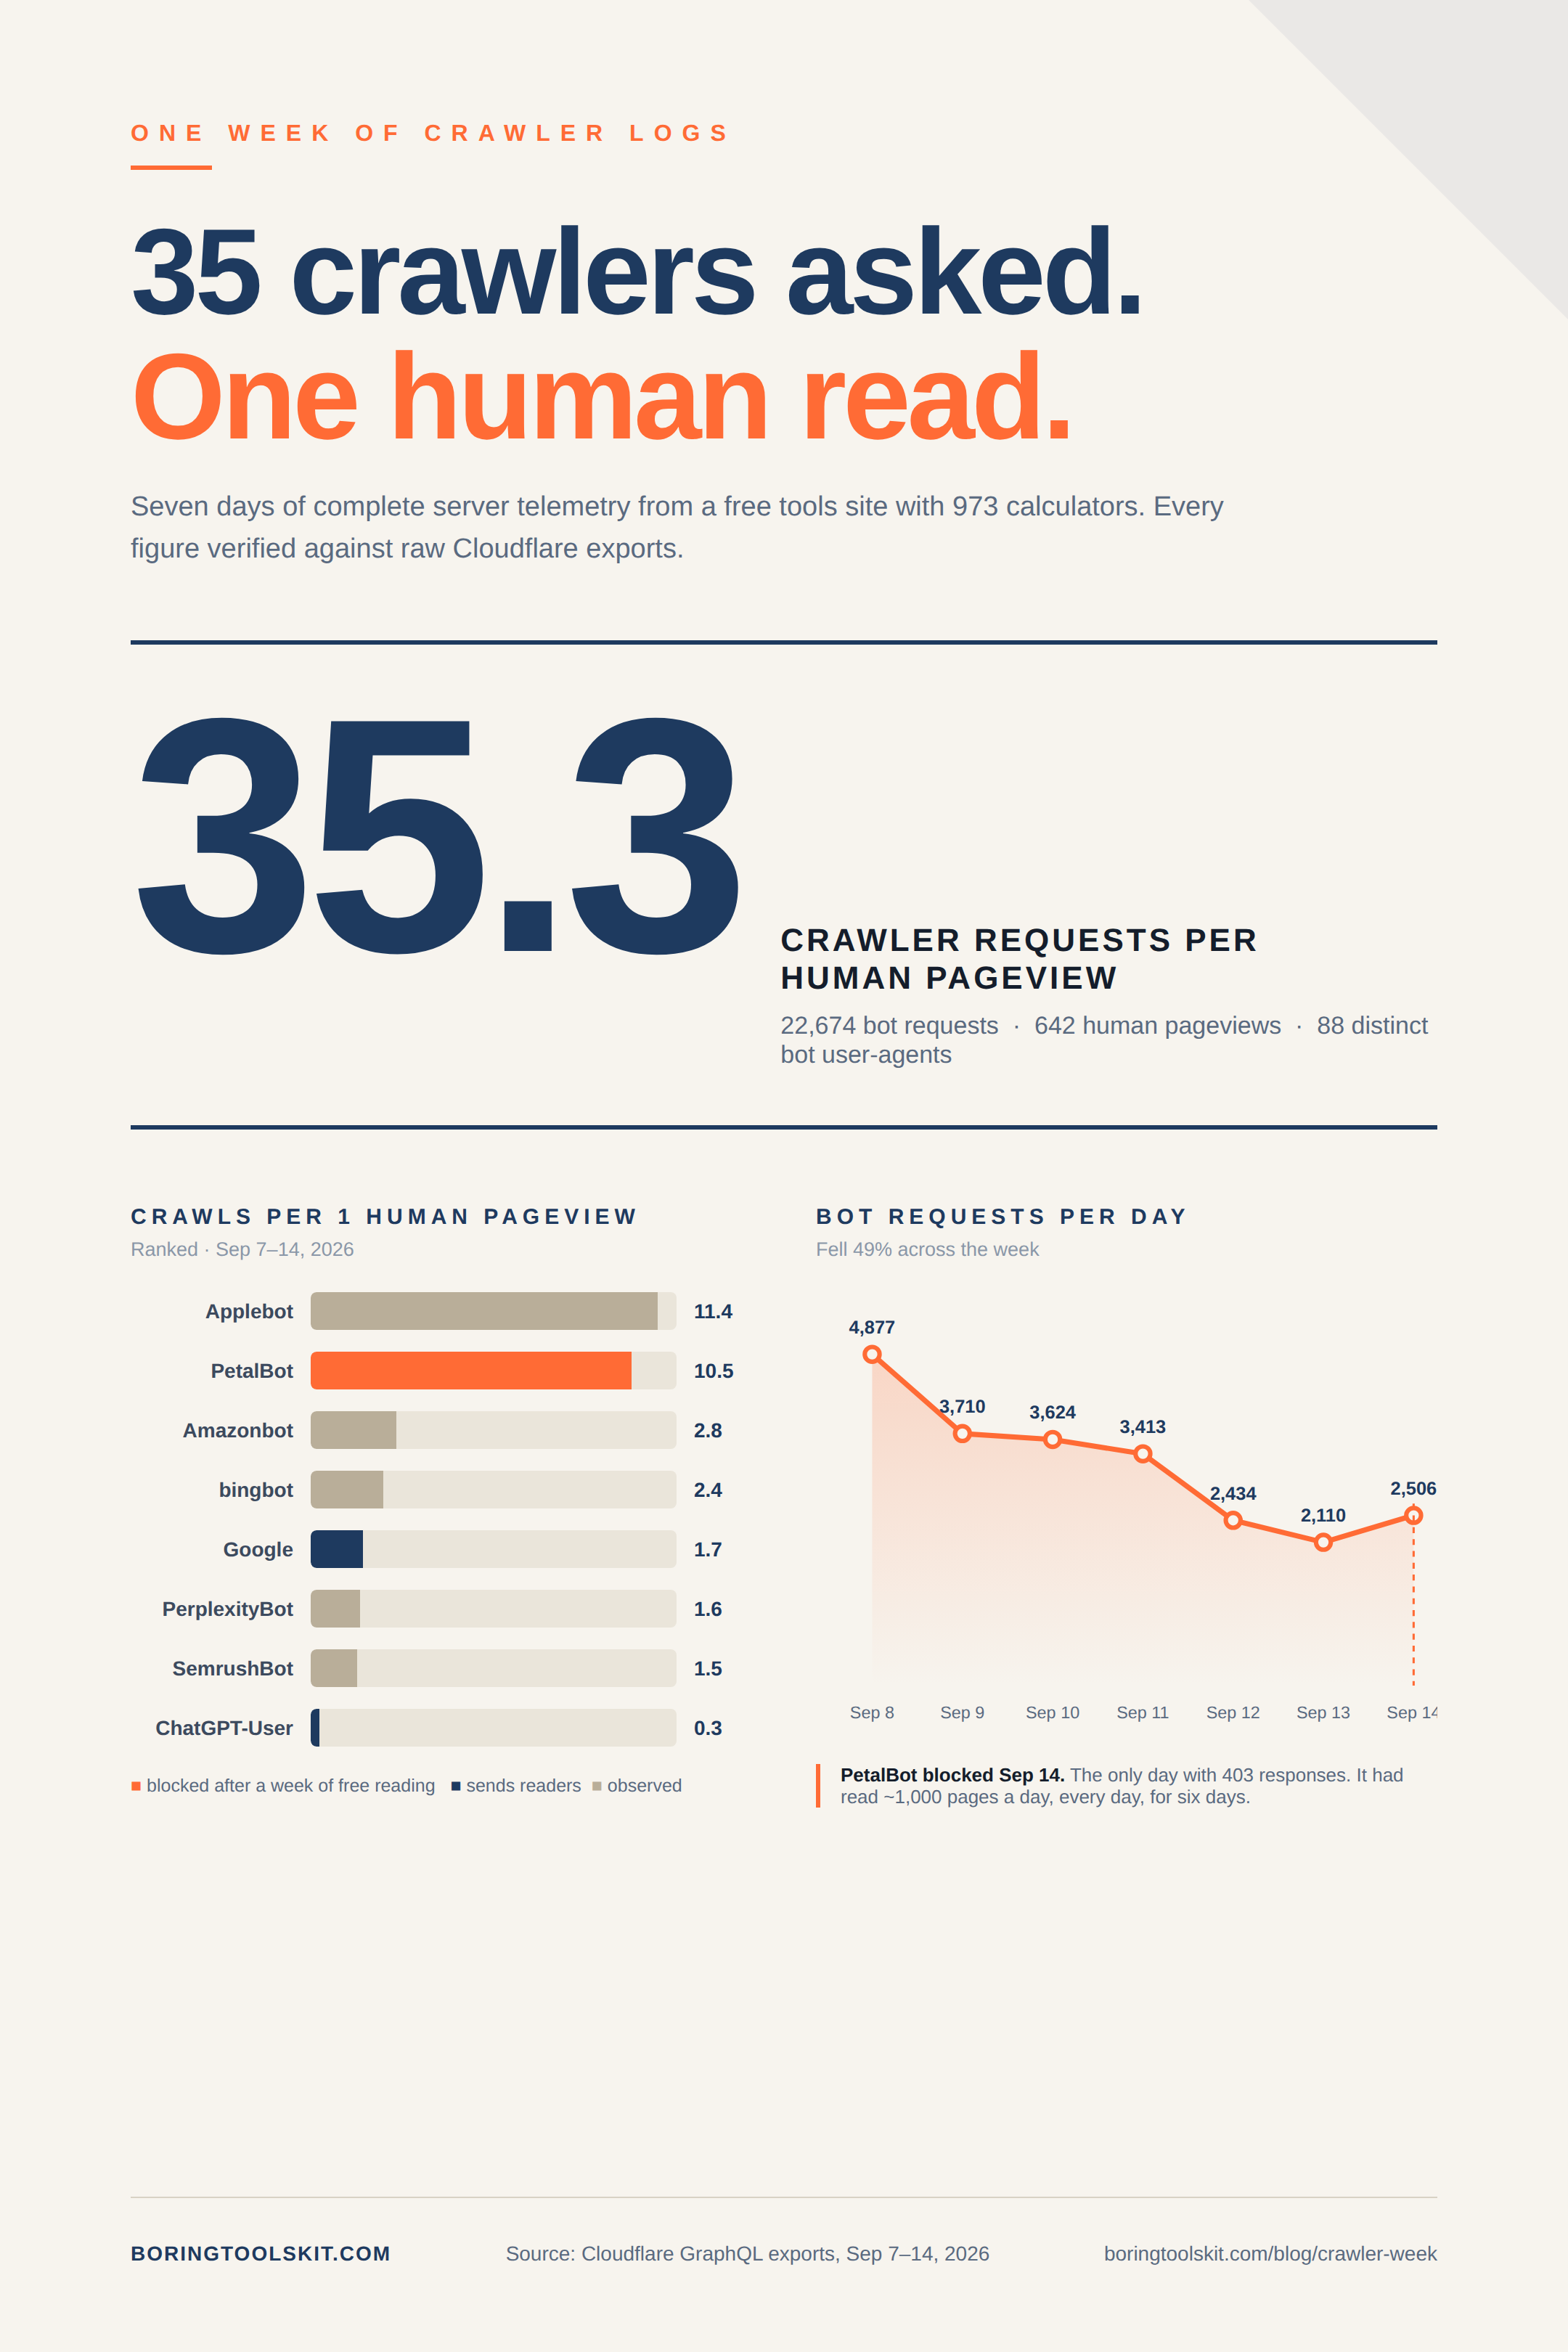
Infographic (light, 2:3): crawler-week.png · Dark variant: crawler-week-dark.png
Why this is citable
- First-party server logs, not vendor network averages.
- Fixed one-week window (Sep 7-14, 2026), methodology published.
- Every number re-derivable from the raw Cloudflare GraphQL exports, linked above.
- Quarterly series: the same study repeats each quarter (Q4 window: Dec 7-13, 2026), building a longitudinal dataset.
Questions or a correction? The site runs a public feedback channel on every tool page.