Data study · September 14, 2026
What 22,674 Crawler Requests Taught Me About AI Bots (One Week, One Tools Site)
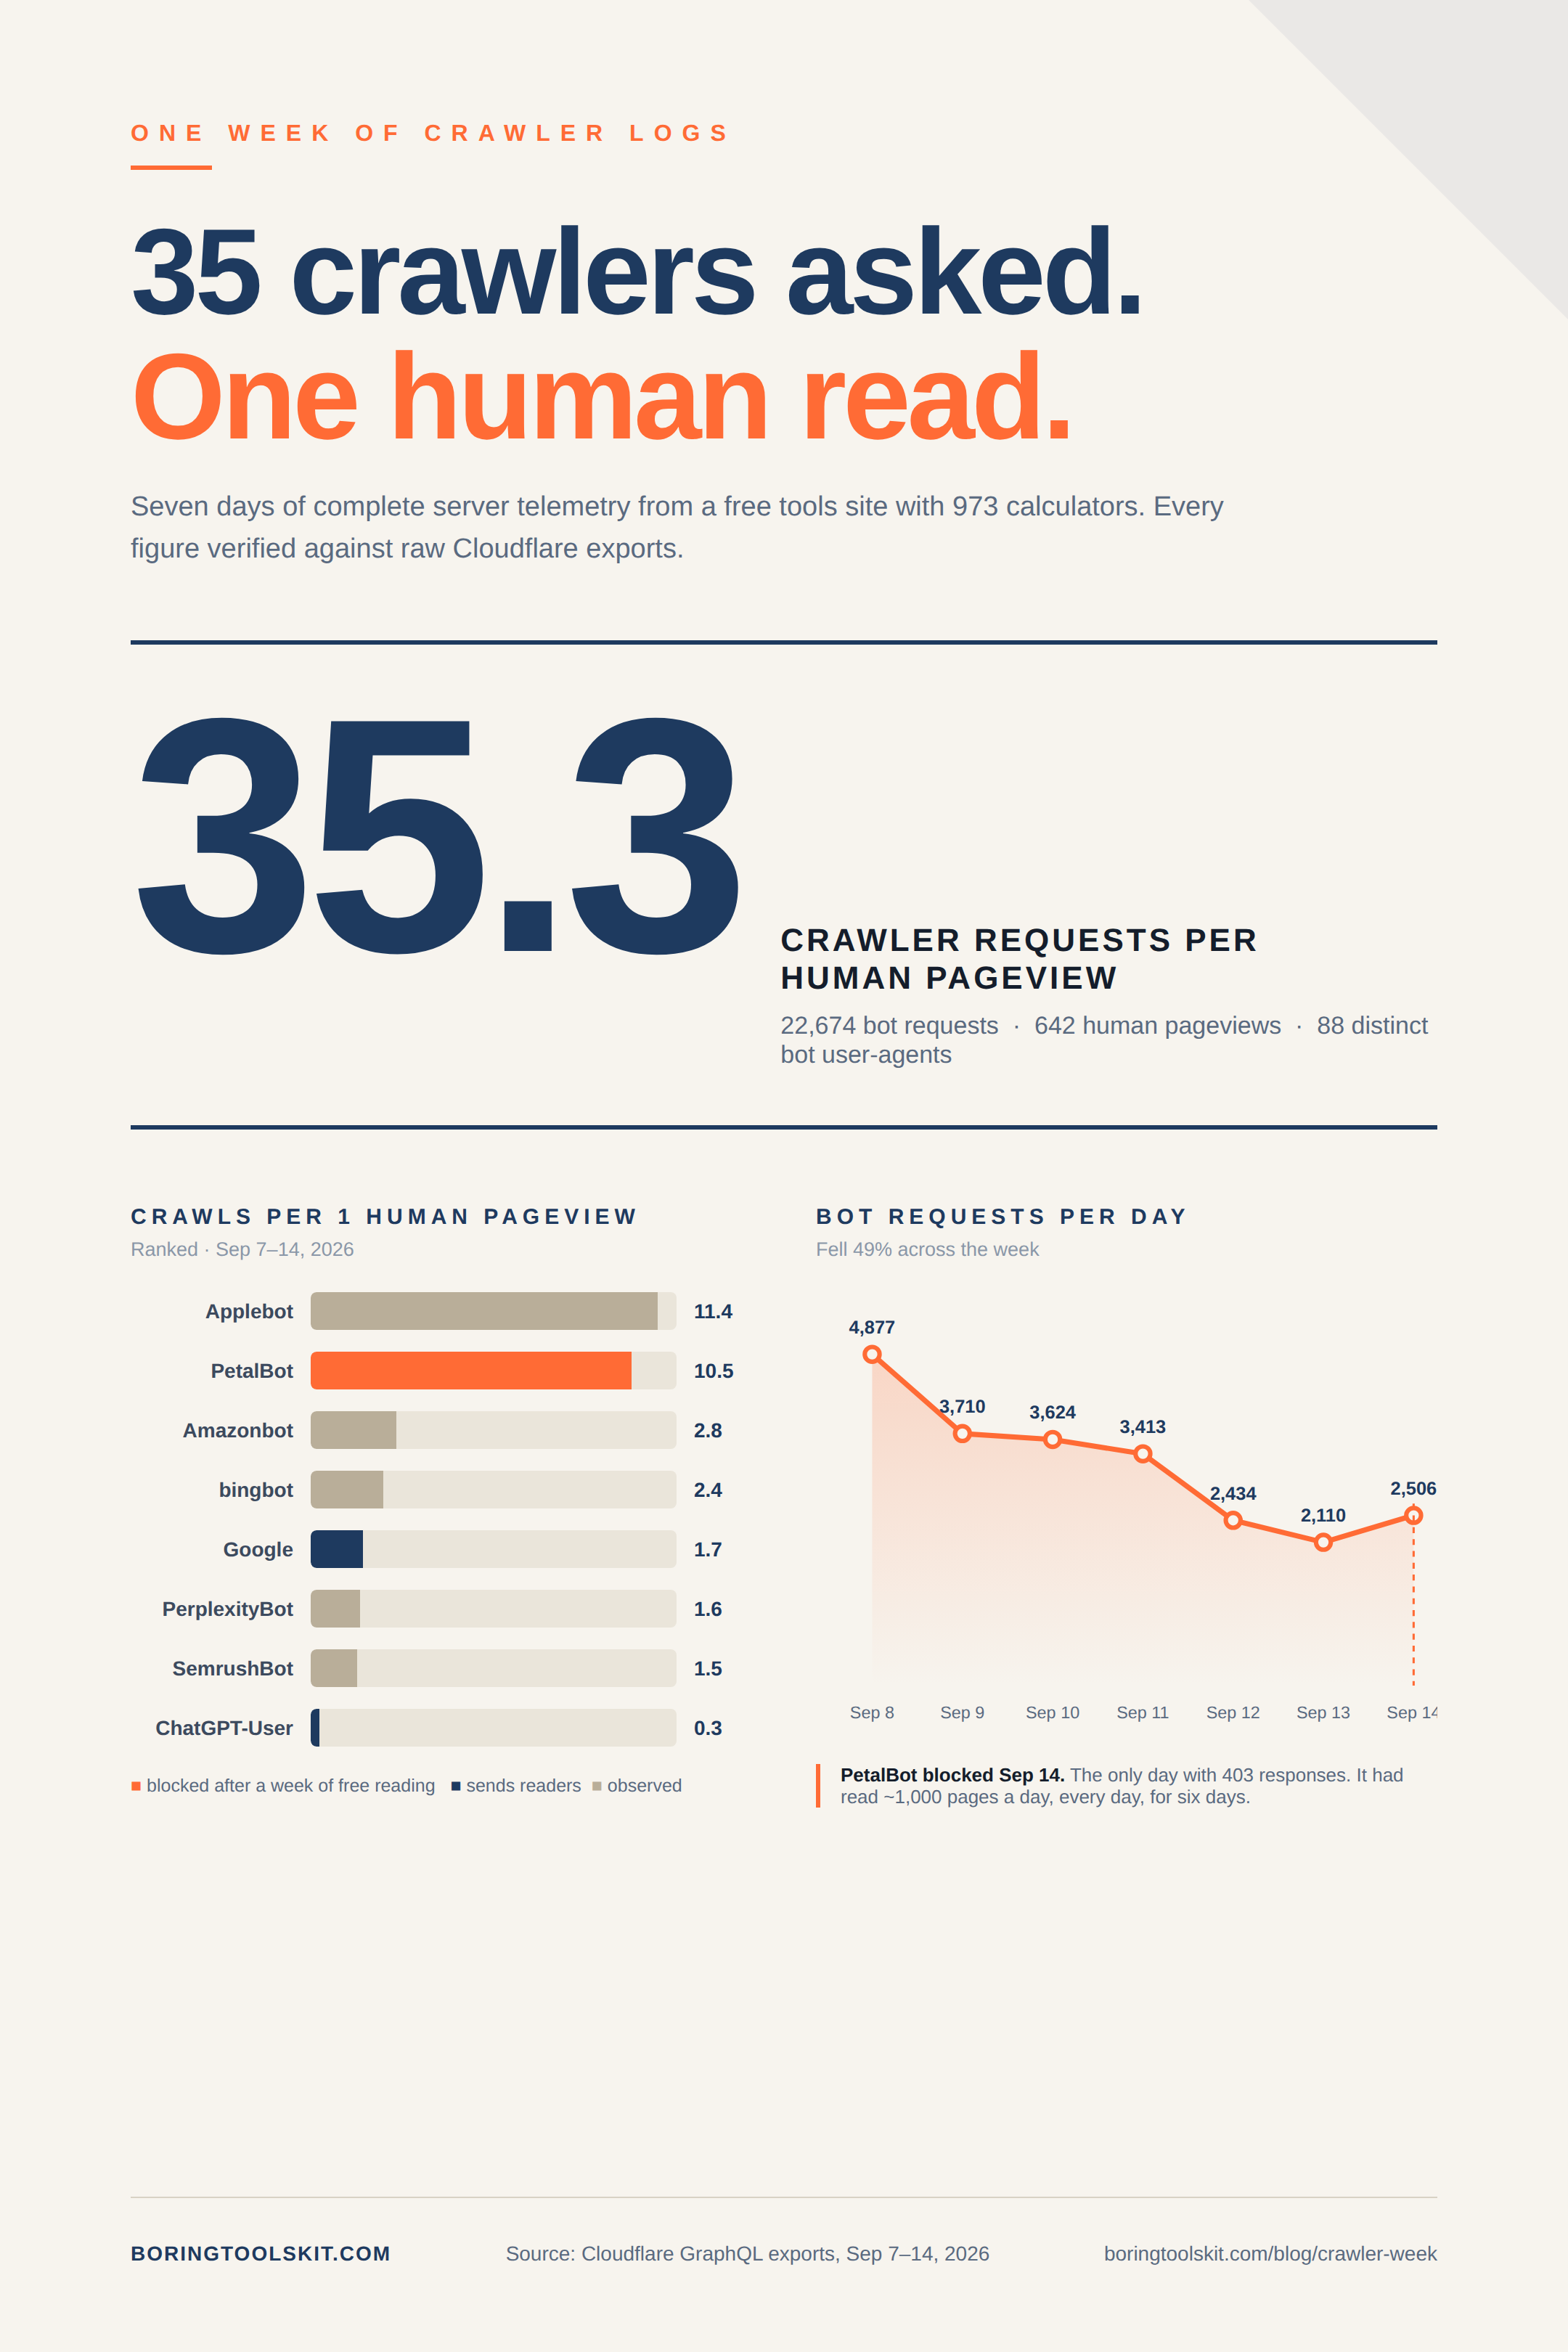
Last week my server answered 77,247 requests. Real humans loaded 642 pages.
Do the math: for every human who read a page, 35 crawlers asked for one.
This is a free calculator site: 1,248 sitemap pages built around a catalogue of 973 tools, no ads revenue yet, no login wall, nothing worth scraping in the traditional sense. I checked exactly what my server served over seven days (September 7-14, 2026), and what I found changed how I think about who, or what, my website is actually for.
The numbers up front
| Metric | Value |
|---|---|
| Total requests served | 77,247 |
| Total bandwidth | 1.44 GB |
| Bot requests (identified UA) | 22,674 (29.4%) |
| Bot bandwidth | 301 MB |
| Human pageviews (CF RUM) | 642 |
| Crawls per human pageview | 35.3 : 1 |
| Distinct bot user-agents | 88 |
The ratio table (the part worth sharing)
I computed what I'm calling the crawl ratio: crawler requests divided by human pageviews over the same week. Lower is better. This is my single favorite metric now.
| Crawler | Requests | Bandwidth | Ratio | What it sends back |
|---|---|---|---|---|
| Applebot | 7,336 | 58.7 MB | 11.4 : 1 | ~nothing measurable |
| PetalBot (Huawei) | 6,719 | 100.0 MB | 10.5 : 1 | nothing, and it ignores blocking |
| Amazonbot | 1,809 | 46.7 MB | 2.8 : 1 | nothing (feeds Rufus/Alexa) |
| bingbot | 1,559 | 16.5 MB | 2.4 : 1 | some referrals |
| Google (family) | ~1,100 | 6.8 MB | 1.7 : 1 | our best referrer |
| PerplexityBot | 1,029 | 20.6 MB | 1.6 : 1 | rare citations |
| SemrushBot | 948 | 14.1 MB | 1.5 : 1 | nothing |
| OAI-SearchBot | 325 | 4.4 MB | 0.5 : 1 | rare |
| ChatGPT-User | 165 | 6.5 MB | 0.3 : 1 | real humans, actually |
Read that table twice. Applebot out-crawled Google's whole crawler family almost 7-to-1. Google, the crawler that actually sends me readers, made a fraction of the requests the "polite" big-tech crawlers made. Huawei's PetalBot consumed more bandwidth than any other crawler, serves a search app most of my visitors have never opened, and (see below) does not respect being told no.
The PetalBot story: a thousand pages a day, then a block that finally worked
On September 14 I blocked PetalBot in Cloudflare's AI Crawl Control. One click.
Here's what the daily data shows happened next:
| Day | PetalBot requests | Status |
|---|---|---|
| Sep 8 | 907 | all HTTP 200 |
| Sep 9 | 975 | all 200 |
| Sep 10 | 979 | all 200 |
| Sep 11 | 1,007 | all 200 |
| Sep 12 | 1,006 | all 200 |
| Sep 13 | 1,006 | all 200 |
| Sep 14 | 664 + 175 blocked | 403s start |
The block works: every request since it went live gets a 403. But it arrived after 6,544 pages had already been read for free, at almost exactly a thousand a day, with machine-like consistency. That regularity is itself the tell: no human reads 1,000 pages a day, every day, including weekends.
The Amazonbot curve: a crawl campaign has a lifecycle
Amazonbot told a different story with its shape alone:
Sep 8:    60      (scoping)
Sep 9:   220      (warming up)
Sep 10:  568      (committing)
Sep 11:  698      (peak)
Sep 12:  205      (winding down)
Sep 13:   42
Sep 14:   14      (gone)
No 403s and no block. Amazonbot was never blocked on my site. It finished. An escalate-peak-decay curve means a crawler ran a planned campaign against my site's 1,248 sitemap pages, read what it came for, and left. It feeds Amazon's Rufus and Alexa. It will never send me a visitor.
Bots don't read your content. They read your junk.
The most-fetched paths by bots were not calculator pages:
/api/comments: 103 requests (an endpoint that only accepts POST; bots kept GETting it)/assets/homepage.js: 101 requests/assets/project-cart.js: 42 requests/all-tools/: 41 requests (finally, an actual page)
Bots burn their budget on JavaScript files and API endpoints no human would ever
"read." Two fixes came out of this: I added Disallow: /api/ to robots.txt, and I
stopped assuming crawler requests mean crawler interest.
The one AI bot that sends real humans
ChatGPT-User is the user-agent ChatGPT sends when an actual person pastes your
URL into a conversation. It made 165 requests this week. That's small, 0.3:1,
but every single one is a human hand on a keyboard, not a crawler's schedule.
PerplexityBot, by contrast, crawled 6x more than ChatGPT-User fetched, and I can count its referrals without taking off my shoes. If you're optimizing for "AI visibility," the honest data says: the bot that visits the most is not the bot that sends the readers.
10 Takeaways for Your Site
- Client-side analytics cannot see any of this. Bots don't run JavaScript. Server logs or Cloudflare's AI Crawl Control are the only ground truth.
- Compute your own crawl ratio. Bot requests ÷ human pageviews. Mine was 35:1. Yours will shock you too.
- The biggest crawler is not the most valuable one. Volume ≠ value. Rank crawlers by referrals, not requests.
- Google is the polite guest. Smallest major crawler by volume, best referrer by far.
- Blocks work but arrive late. Every day you don't block a value-draining crawler is another ~1,000 pages read.
- Crawl campaigns have shapes. Flat-line daily volume = scheduled scraping. Escalate-peak-decay = a completed campaign.
- robots.txt Disallow your POST-only endpoints before bots waste a month GETting them.
- ChatGPT-User is the only AI UA that means a human acted. Watch it even though it's tiny.
- Bandwidth is the honest cost metric. Requests lie; MB doesn't. PetalBot: 100 MB/week for zero return.
- Check your logs this week. Every site owner I've shared this ratio with has been off by an order of magnitude in their guess.
Methodology and limitations
- Source: Cloudflare GraphQL Analytics API (
httpRequestsAdaptiveGroups), 7 daily windows, September 7-14, 2026,requestSource: "eyeball", bot classification by user-agent matching (bot/Bot/spider/crawler/slurp patterns). - Human pageviews: Cloudflare RUM (JavaScript-based), same window: 642.
- Known limits: UA-based bot detection misses sophisticated bots that spoof browser UAs (they appear in the human number, so the true ratio is likely worse than 35:1). Referral attribution for AI platforms requires a paid Cloudflare plan, so "what it sends back" for AI bots is from RUM observations, not server-side attribution.
- Scope: one site, one week. This is a single-operator measurement, not an industry study. The patterns match what Cloudflare Radar and Ahrefs report at web scale; the exact numbers are mine alone.
The exact queries, so you can run this yourself
# Daily bot requests by user agent (free plan: 1-day windows; loop 7x)
curl -s -X POST https://api.cloudflare.com/client/v4/graphql \
  -H "Authorization: Bearer $CF_TOKEN" \
  -H "Content-Type: application/json" \
  --data '{"query":"{ viewer { zones(filter: {zoneTag: \"ZONE_ID\"}) {
    httpRequestsAdaptiveGroups(limit: 5000, filter: {
      datetime_geq: \"2026-09-08T00:00:00Z\", datetime_leq: \"2026-09-09T00:00:00Z\",
      requestSource: \"eyeball\",
      OR: [{userAgent_like: \"%bot%\"}, {userAgent_like: \"%Bot%\"}, {userAgent_like: \"%spider%\"}]
    }, orderBy: [count_DESC]) {
      count dimensions { userAgent } sum { edgeResponseBytes } } } } }"}'
(That's the exact query. Seven runs, one per day, then group by UA. My collection script is at the link below.)
BoringToolsKit is a free, no-login collection of 973 calculators and converters across 20+ categories. This study is part of an ongoing transparency series. All site telemetry claims on this blog come with their raw data.