Updates automatically as you type.
Calculated in your browser; your inputs are not sent to us. Privacy
Calculation details
Planning estimate only, not financial, tax, or legal advice. Verify assumptions and current rules before making decisions.
This tool runs in your browser. Your calculator inputs and results are never transmitted to us or to ad/affiliate partners. Ads and sponsored links may set third-party cookies to serve and measure them, but they never receive your calculation values. If you explicitly save a scenario, its permitted fields stay in local browser storage until you clear them. See our Privacy Policy.
Use this result
Share the current inputs or ask ChatGPT to explain the calculation in context.
More options
What does this calculator estimate?
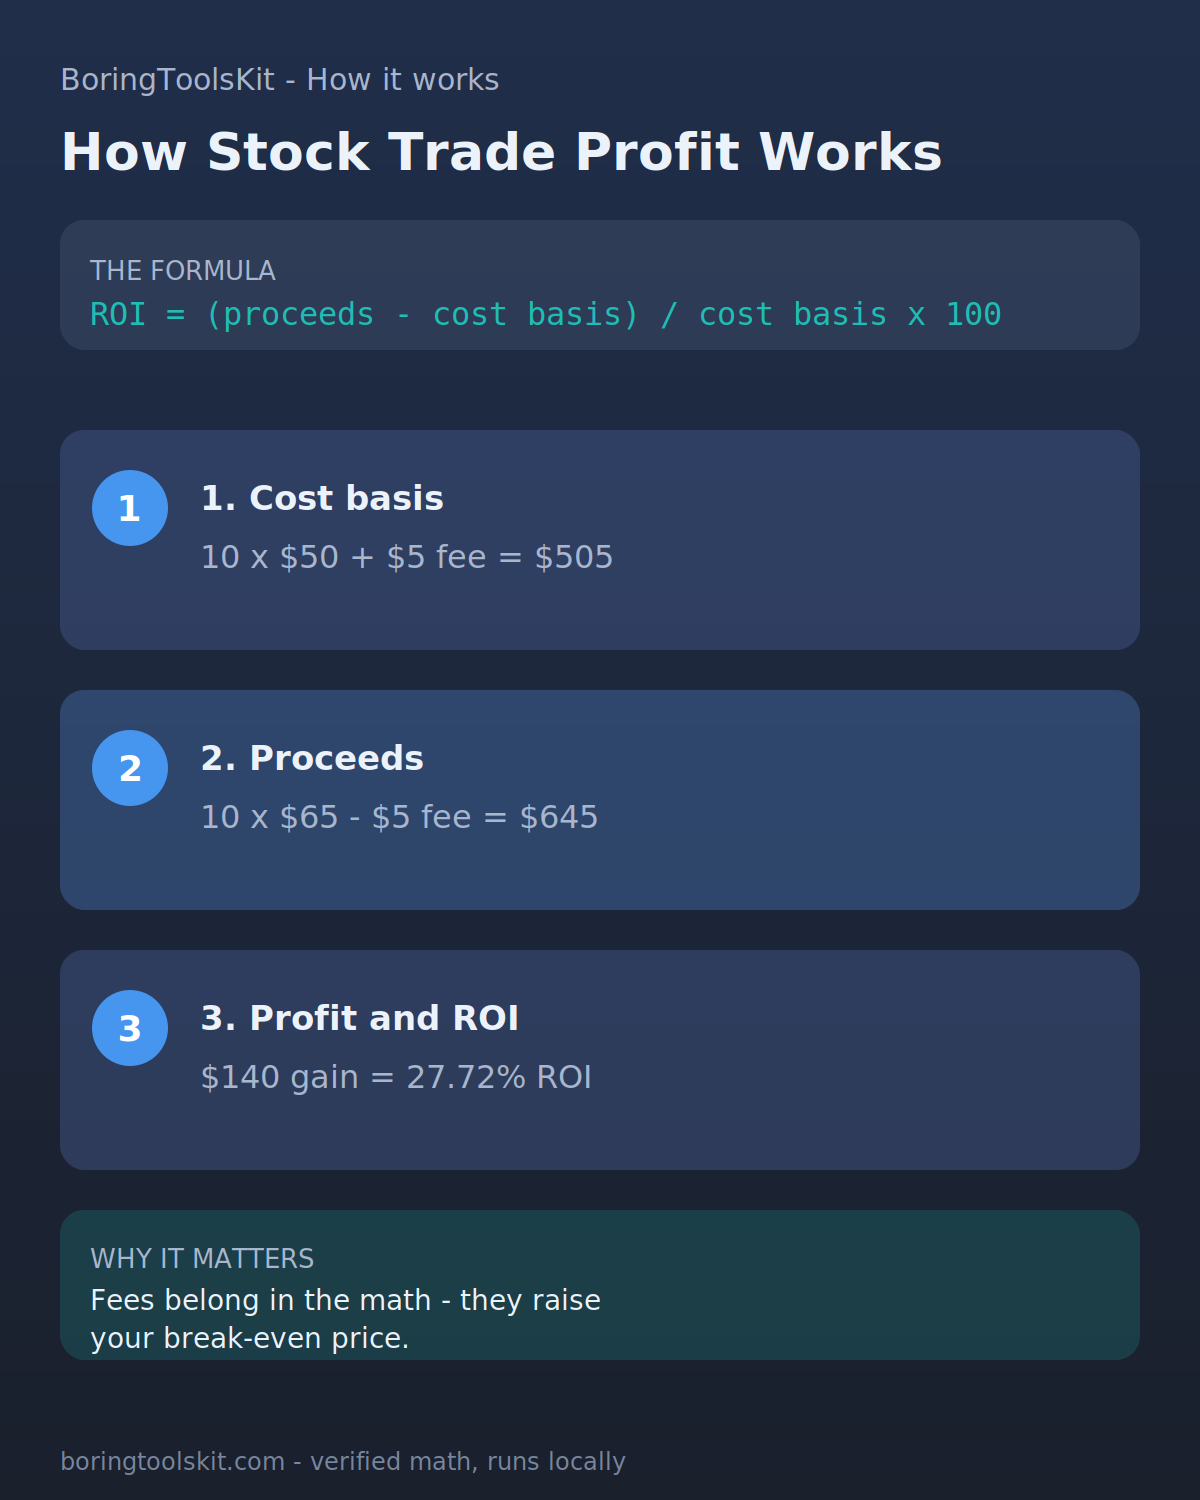
Selling 10 shares bought at $50 with $5 fees on each side returns $645 in proceeds against a $505 cost basis: a $140 profit, a 27.72% ROI before taxes. ROI is proceeds minus cost basis, divided by cost basis. Use the BoringToolsKit stock calculator to run your own buy price, sell price, share count, and fees.
- ROI on a stock trade is (proceeds minus cost basis) divided by cost basis, times 100. (Source: Investor.gov, US Securities and Exchange Commission)
- Trading fees belong in the cost basis: a $5 buy fee on 10 shares adds $0.50 per share to your break-even price. (Source: BoringToolsKit calculation methodology)
- The 27.72% example ROI is a pre-tax figure; capital gains taxes are not included. (Source: IRS)
Why percent ROI and dollar profit point at different trades
ROI is profit divided by cost basis, so it rewards small bases. A $1,000 trade that sells for $1,400 shows a 40% ROI and a $400 profit. A $10,000 trade that sells for $10,500 shows a 5% ROI and a $500 profit. The percentage says the first trade was more efficient with its capital; the dollar column says the second trade put more money in your pocket. Both statements are true, which is exactly why the calculator reports both instead of one headline number.
Fees tilt this comparison at small trade sizes. A $5 buy fee and a $5 sell fee subtract $10 from every round trip. On the $1,000 trade that is 1% of basis; on a $20,000 trade it is 0.05%. If you run both trades through the calculator with real fee figures instead of zeros, the percent column moves much more on the small side. That is arithmetic, not a claim that big trades are better; it only says the fee you pay is fixed in dollars while the denominator is not. When two trades differ mainly in size, the efficient one earns more per dollar while the larger one earns more dollars; pick which framing matches the decision you are actually making.
What this calculator deliberately leaves out
The output is a per-trade figure: cost basis, proceeds, profit, and ROI for one round trip on one lot of shares. It does not subtract tax on the gain, it does not count dividends paid while you held, and it does not adjust for stock splits between buy and sell. A stock that split two-for-one mid-holding needs its buy price divided by two before the inputs match the units. If you type split-adjusted price on one side and raw price on the other, the profit number is meaningless.
It also attaches no time to the result. A 27.72% ROI over four months and a 27.72% ROI over eight years compute to the same line on the page. Annualizing is a separate division you would have to do yourself, and even that is only a fair approximation when the holding is more than a year. Treat the output as a way to compare completed or hypothetical trades on their own dollar terms, not as an annual return you can stack against a savings rate. Keep the input units consistent end to end and the arithmetic stays dependable; a split half-accounted-for is the most common way these numbers quietly break.
Two multiplications that confirm the output
Every value here is reachable with a phone calculator in about thirty seconds, which makes it the easiest tool in the category to audit. For the example numbers: 10 shares at $50 is 500, plus the $5 buy fee makes a $505 basis. At $65 the sale is 650, minus the $5 sell fee makes $645 of proceeds. Profit is 645 minus 505, or $140, and 140 divided by 505 is 0.2772, so 27.72% ROI.
A useful reverse check: multiply the basis by the reported ROI as a decimal and add it back, 505 times 1.2772, which lands near 645. When the loop does not close, the usual culprit is the share count. Typing 100 instead of 10 is the most common input error we see in feedback, and it produces a result that looks plausible on every other line. Running the two multiplications by hand catches it instantly. Two multiplications and one division is all the tool does, so an input error is always one hand-check away from being found. Thirty seconds of hand arithmetic beats an hour of wondering whether the inputs were right.
Holding period changes what a percent means
The example trade's 27.72% ROI means something different depending on how long the shares were held. Spread over eight years the same gain averages to roughly 3.5% per year before any compounding, which is a simple division of 27.72 by 8 and only a rough approximation. Earned over four months it annualizes to something over 80%, which sounds dramatic but happened once and guarantees nothing about the next trade. The calculator will not compute either figure, because annualization involves assumptions it cannot check.
This matters most when the result is being used to decide something, such as whether selling is arithmetically better than holding another year. The only input the calculator can give that decision is the current spread between proceeds and basis. What the market does over the next year is outside the tool, and acting as if a past ROI predicts a future one is the misstep this section exists to flag. Use the number to describe the trade you input, and use your own judgment for everything that has not happened yet. A percent without a holding period attached is a description, not a performance record.
How this calculator works
Formula
Cost basis = buy price × shares + buy fee. Proceeds = sell price × shares − sell fee. Profit/loss = proceeds − cost basis. ROI = profit/loss ÷ cost basis × 100.
Worked example
Buying 10 shares at $50 with a $5 buy fee gives a $505 cost basis. Selling at $65 with a $5 sell fee gives $645 proceeds, $140 profit, and about 27.72% ROI before taxes.
Assumptions to verify
- Prices, share count, and fees are user-entered estimates; this is not a live quote or brokerage confirmation.
- Taxes, dividends, corporate actions, currency conversion, and wash-sale rules are not included.
- A negative result is a loss; ROI is shown relative to total cost basis including the buy fee.
Frequently asked questions
Does this include dividends?
No. Add dividends separately when comparing total return; this page estimates price profit after explicit buy and sell fees.
Can ROI be negative?
Yes. If proceeds are below cost basis, the profit/loss and ROI are shown as negative values.
Is this tax or investment advice?
No. It is arithmetic for a planned or completed trade. Verify lots, fees, dividends, and tax rules before making decisions.
Cite this tool
BoringToolsKit. “Share Profit Calculator.” boringtoolskit.com/stock-calc/. Free to reference in articles, syllabi, and answer posts with a link.
Privacy: Inputs and results stay in this browser. Any future sponsored recommendation or advertisement will be clearly labeled and kept separate from the calculation.