A1c Calculator

A1c calculator: convert your average blood glucose reading into an estimated hemoglobin A1c percentage instantly. Free, runs locally in your browser, no signup.

Updates automatically as you type.

Calculated in your browser; your inputs are not sent to us. Privacy

Results will appear here.

General estimate for planning only — not medical advice. Consult a doctor about your specific situation.

Calculation details
Every figure above is calculated locally in your browser from the assumptions shown. No inputs are sent anywhere. See the methodology section below for how this tool works.
Use this resultShare the current inputs, or ask ChatGPT to explain the calculation in context.
Ask an AI to explain this result
Share this result

Review the generated output before relying on it.

This tool runs in your browser. Your calculator inputs and results are never transmitted to us or to ad/affiliate partners. Ads and sponsored links may set third-party cookies to serve and measure them, but they never receive your calculation values. If you explicitly save a scenario, its permitted fields stay in local browser storage until you clear them. See our Privacy Policy.

Use this result

Share the current inputs or ask ChatGPT to explain the calculation in context.

More options
Report a calculation issue
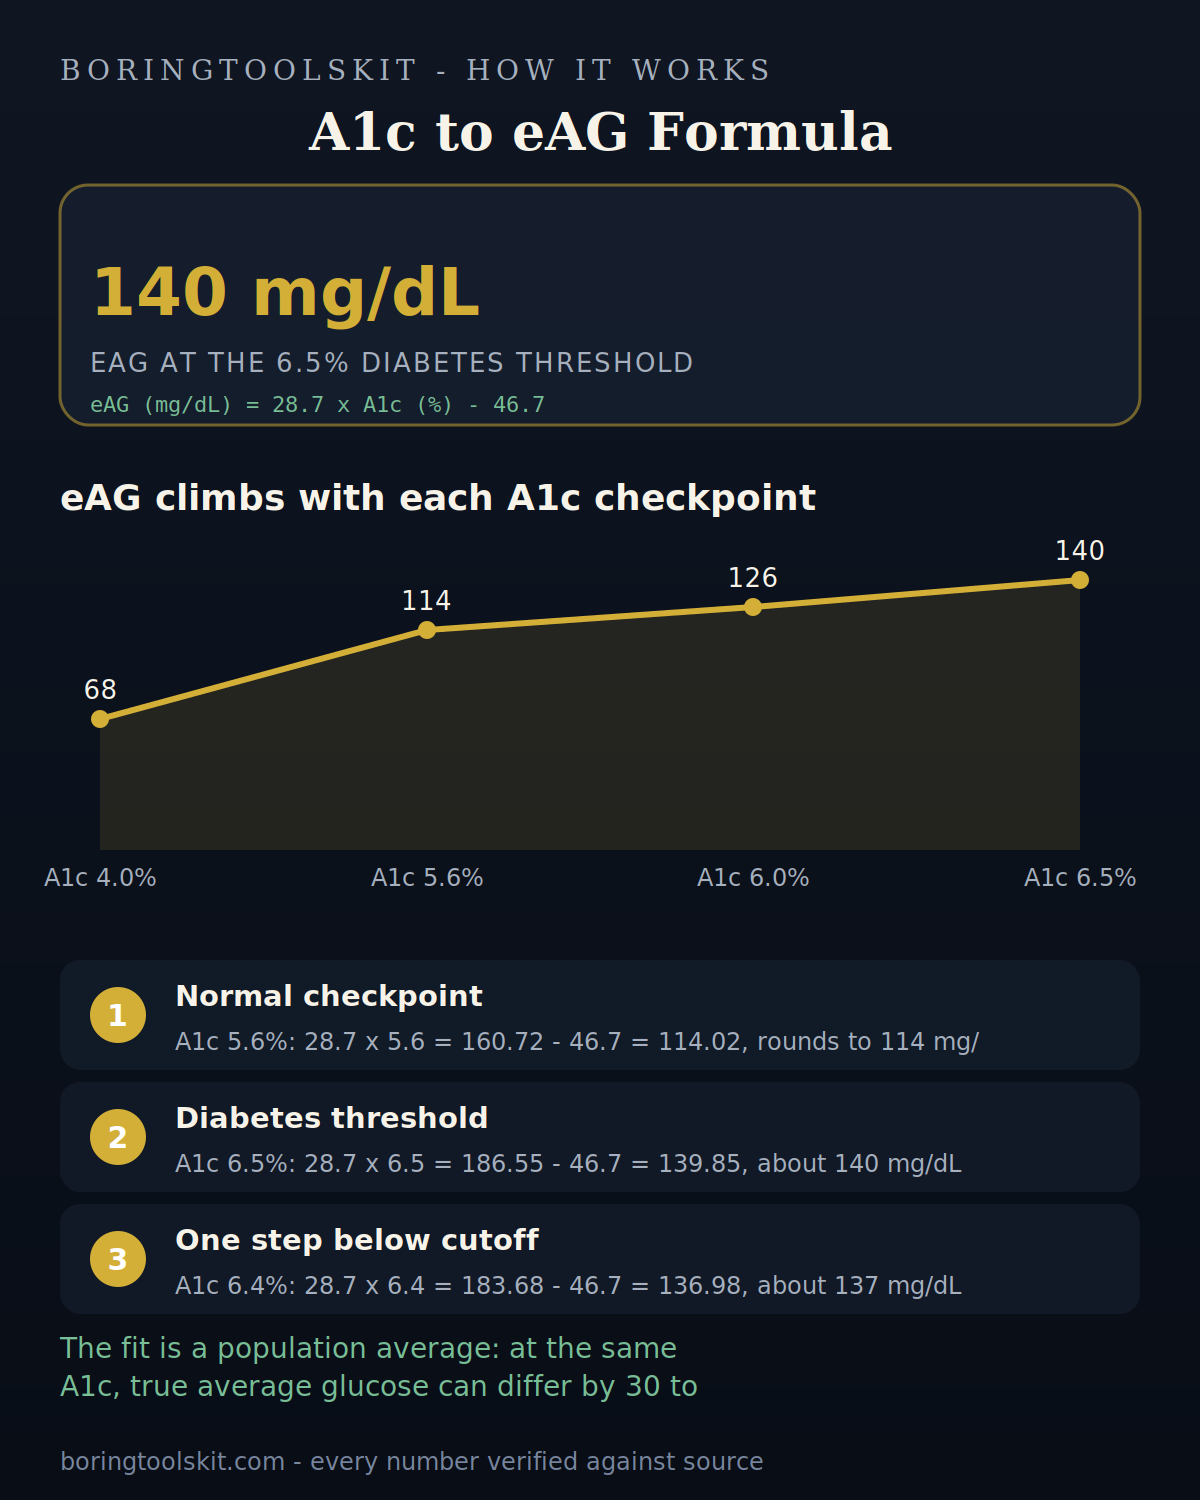
eAG trend across A1c checkpoints 4.0, 5.6, 6.0 and 6.5 percent
Every 0.1% A1c change moves eAG by 2.87 mg/dL.
Method & verification

How This Tool Works

fact-checked against our calculation methodology

Calculation Method

Computes eAG from HbA1c.

Site methodology

No unrelated authority link is added merely to make this page look sourced. Tool-specific external sources are shown only when they directly support the method, rate, or rule.

Assumptions to Verify

  • These tools provide general estimates for planning and education only.
  • They are not medical advice and not a substitute for a qualified healthcare professional.
  • Always consult your doctor or another healthcare provider about your specific situation.

Privacy: The calculation runs in this browser. Shared links contain the page address only, not your inputs or results.

Worked examples at three checkpoints

The formula is linear, so every 0.1% change in A1c moves eAG by exactly 2.87 mg/dL. Take A1c 5.6%, the top of the normal band: 28.7 x 5.6 = 160.72, then 160.72 - 46.7 = 114.02, which rounds to 114 mg/dL. At A1c 6.0% (prediabetes range): 28.7 x 6.0 = 172.2, minus 46.7 gives 125.5, rounding to 126 mg/dL.

Now the diabetes threshold at 6.5%: 28.7 x 6.5 = 186.55, then 186.55 - 46.7 = 139.85, or 140 mg/dL. That 14 mg/dL jump between the 6.0 and 6.5 results is what a single half-point A1c rise costs. A practical checkpoint: if your lab report shows A1c 6.4%, the calculator gives 28.7 x 6.4 = 183.68 - 46.7 = 136.98, about 137 mg/dL, one step below the 6.5% cutoff. If your meter's 14-day or 30-day average reads wildly different from that eAG, the mismatch itself is data, and it usually means glucose is swinging rather than sitting flat.

Where the estimate breaks down

The 28.7/-46.7 line is a population regression from the ADAG study (about 1,400 participants), so it is a fitted average, not a per-person law. The study's own scatter shows individuals at the same A1c landing roughly 30 to 40 mg/dL apart in true average glucose. Red blood cell lifespan is the main culprit: hemolytic anemia shortens cell life and makes A1c read falsely low, while iron deficiency anemia can push it falsely high. Pregnancy, recent blood loss, and kidney dialysis shift it too.

Edge cases in the calculator itself: it accepts 3.0% to 15.0% and rejects anything outside. Below 3% is not a plausible lab value and above 15% (eAG about 384 mg/dL) the linear fit loses accuracy, since the ADAG cohort rarely included extremes. Note the asymmetry of the formula: at A1c 4.0% it computes an eAG of 68 mg/dL, which is below most meters' usable floor of 40 mg/dL, so treat low-range outputs as directional only. The output is an estimate of average glucose over the prior 2 to 3 months, not a diagnosis, and CGM users should compare it against their own 90-day GMI rather than trusting the population curve.