Standard Error Calculator

Calculate the standard error of the mean (SEM). Enter sample standard deviation and size to measure how precise the sample mean is.

SEM = s / √n. Smaller SEM means the sample mean is a more precise estimate of the population mean.

Results will appear here.
Calculation details
Every figure above is calculated locally in your browser from the assumptions shown. No inputs are sent anywhere. See the methodology section below for the formulas used.
Use this resultShare the current inputs, or ask ChatGPT to explain the calculation in context.
Ask an AI to explain this result
Share this result

Planning estimate only, not financial, tax, or legal advice. Verify assumptions and current rules before making decisions.

This tool runs in your browser. Your calculator inputs and results are never transmitted to us or to ad/affiliate partners. Ads and sponsored links may set third-party cookies to serve and measure them, but they never receive your calculation values. If you explicitly save a scenario, its permitted fields stay in local browser storage until you clear them. See our Privacy Policy.

Use this result

Share the current inputs or ask ChatGPT to explain the calculation in context.

More options
Report a calculation issue
Direct answer

What does this calculator estimate?

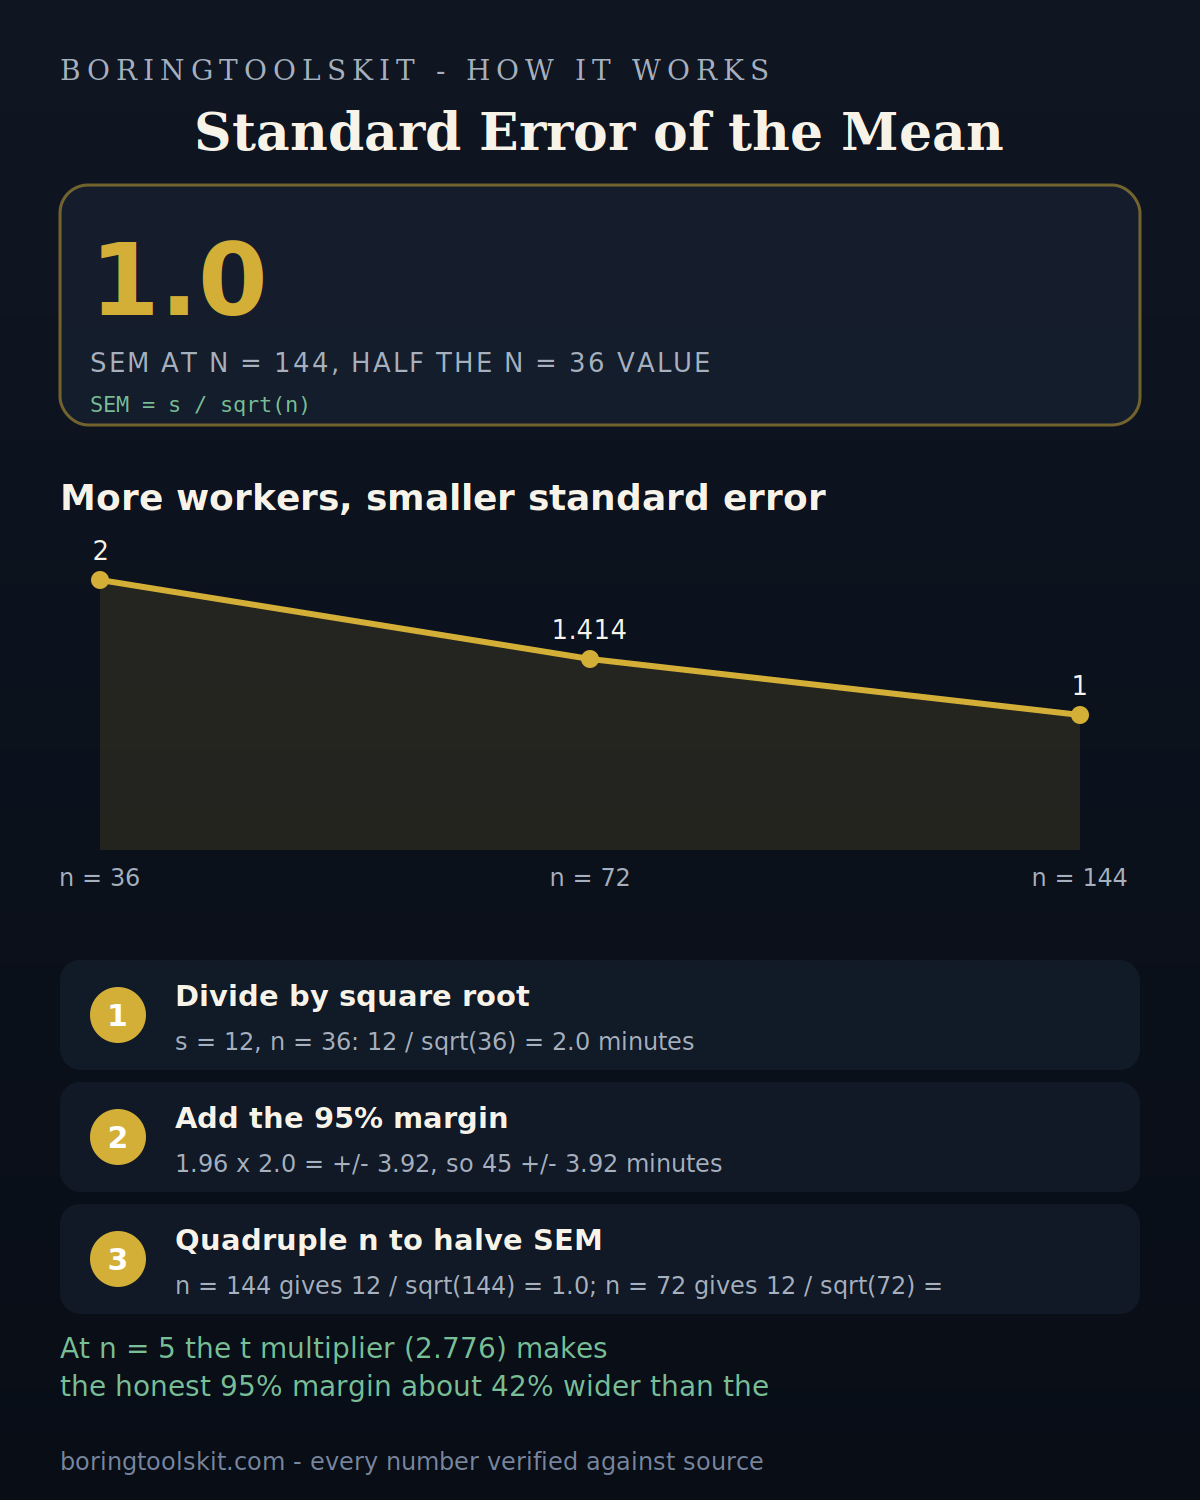
With a standard deviation of 12 and a sample size of 36, the standard error of the mean is 12 / sqrt(36) = 2.0, so the 95 percent margin is plus or minus 1.96 x 2.0 = 3.92. Larger samples shrink the standard error.

  • Standard error of the mean = standard deviation divided by the square root of sample size (NIST).
  • The 95 percent margin of error uses 1.96 standard errors.
  • Doubling the sample size cuts the standard error by about 30 percent.

What the standard error tells you

The standard error measures how far the sample mean is likely to be from the true population mean. It shrinks as the sample grows — more data means a more precise estimate. It's the basis for confidence intervals and hypothesis tests.

Limitations to watch for

SEM is not the same as the standard deviation: SD describes data spread; SEM describes estimate precision. The formula assumes a random sample. Small samples (n < 30) call for the t-distribution in formal inference.

How to use it in practice

Use SEM to gauge how reliable your sample mean is: multiply by ~1.96 for a rough 95% margin of error. Report SEM alongside means in research. To halve the SEM, quadruple the sample size.

['Enter the sample standard deviation.', 'Enter the sample size.', 'Read the standard error of the mean.']

What the standard error measures

The standard error of the mean (SEM) estimates how precisely a sample mean estimates the population mean: SEM = standard deviation ÷ √n. A sample of 25 with SD 10 has SEM 2 — the estimate is precise to roughly ±4 at 95 percent confidence.

SEM vs. standard deviation

SD describes the spread of the data; SEM describes the precision of the mean. The same dataset has one SD but a smaller SEM, and the SEM shrinks as the sample grows — quadruple the sample and the SEM halves. Mixing the two is the most common error in reported statistics.

Why sample size matters

The √n in the denominator is the whole story: n = 100 gives SEM = SD/10; n = 10,000 gives SD/100. More data always sharpens the estimate, but with diminishing returns — doubling precision requires quadrupling the sample. The calculator makes the trade visible.

A worked example

A survey of 400 shoppers finds mean spend $85 with SD $20: SEM = 20 ÷ 20 = $1. The 95 percent confidence interval is about $85 ± $2. The calculator returns the SEM and the interval so the result can be reported honestly.

Reporting standards

Papers and dashboards should report SEM (or CI) alongside the mean when the claim is about the population. Reporting only the mean hides the uncertainty; reporting only the SD conflates data spread with estimate precision. The calculator supports the correct pairing.

Transparent methodology

How this calculator works

Reviewed 2026-08-25 · BoringToolsKit Editorial Team

Formula

Standard error of the mean = sample standard deviation ÷ √n, where n is the sample size. It estimates how much the sample mean varies from the true population mean.

Worked example

A sample standard deviation of 10 from 25 observations: SEM = 10 ÷ √25 = 2.0.

Assumptions to verify

  • The sample is random and representative.
  • The standard deviation is the sample SD.
  • The population is much larger than the sample.

Frequently asked questions

What is the standard error?

The standard deviation of the sample mean — how far the sample mean is likely from the true mean. SD ÷ √n.

How is it calculated?

Sample standard deviation ÷ √sample size. SD 10, n 25 → 2.0.

What's the difference from standard deviation?

SD measures how spread out the data is; SEM measures how precise the sample mean estimate is.

How does sample size affect it?

Larger samples shrink the SEM: quadruple n to halve the error.

How do I build a confidence interval?

Mean ± 1.96 × SEM is a rough 95% interval for large samples.

Is SEM used in hypothesis testing?

Yes — many tests divide an effect by its standard error to get a test statistic.

What if my sample is small?

Use the t-distribution instead of the normal approximation for n under ~30.

How do I calculate SEM?

Standard deviation ÷ √n.

What is the difference between SEM and SD?

SD is data spread; SEM is estimate precision — SEM shrinks as n grows.

How do I get a confidence interval?

Roughly mean ± 2 × SEM for 95% confidence with large samples.

Cite this tool

BoringToolsKit. “Standard Error Calculator.” boringtoolskit.com/standard-error-calculator/ (reviewed 2026-08-25). Free to reference in articles, syllabi, and answer posts with a link.

Privacy: Inputs and results stay in this browser. Any future sponsored recommendation or advertisement will be clearly labeled and kept separate from the calculation.