Calculation details
Planning estimate only, not financial, tax, or legal advice. Verify assumptions and current rules before making decisions.
This tool runs in your browser. Your calculator inputs and results are never transmitted to us or to ad/affiliate partners. Ads and sponsored links may set third-party cookies to serve and measure them, but they never receive your calculation values. If you explicitly save a scenario, its permitted fields stay in local browser storage until you clear them. See our Privacy Policy.
Use this result
Share the current inputs or ask ChatGPT to explain the calculation in context.
More options
What does this calculator estimate?
Rent vs buy calculator: compare monthly renting costs against owning a home including mortgage, taxes, and upkeep to find your break-even point. Free, no signup.
Which costs does renting hide in plain sight?
Renters pay rent plus renter's insurance, utilities, and the reality of annual increases. What they avoid are property tax, maintenance, insurance on the structure, and the transaction costs of buying and selling. The honest comparison puts a number on flexibility too: breaking a lease costs far less than selling a house in a soft market, and that option has value.
How long until buying beats renting?
The breakeven is dominated by transaction costs and appreciation assumptions. Closing costs of 2-5% must be amortized over years of ownership, which is why short stays usually favor renting. Run the comparison at several holding periods: if buying wins only at year twelve and you expect to move at year five, the monthly number flatters the purchase.
How this calculator works
Formula
The buyer scenario amortizes the mortgage monthly, grows home value, subtracts estimated selling costs and remaining loan, and reports net equity. The renter scenario invests the buyer’s upfront cash and each monthly difference between ownership cost and rent. The result compares buyer equity with the renter portfolio at the selected horizon.
Worked example
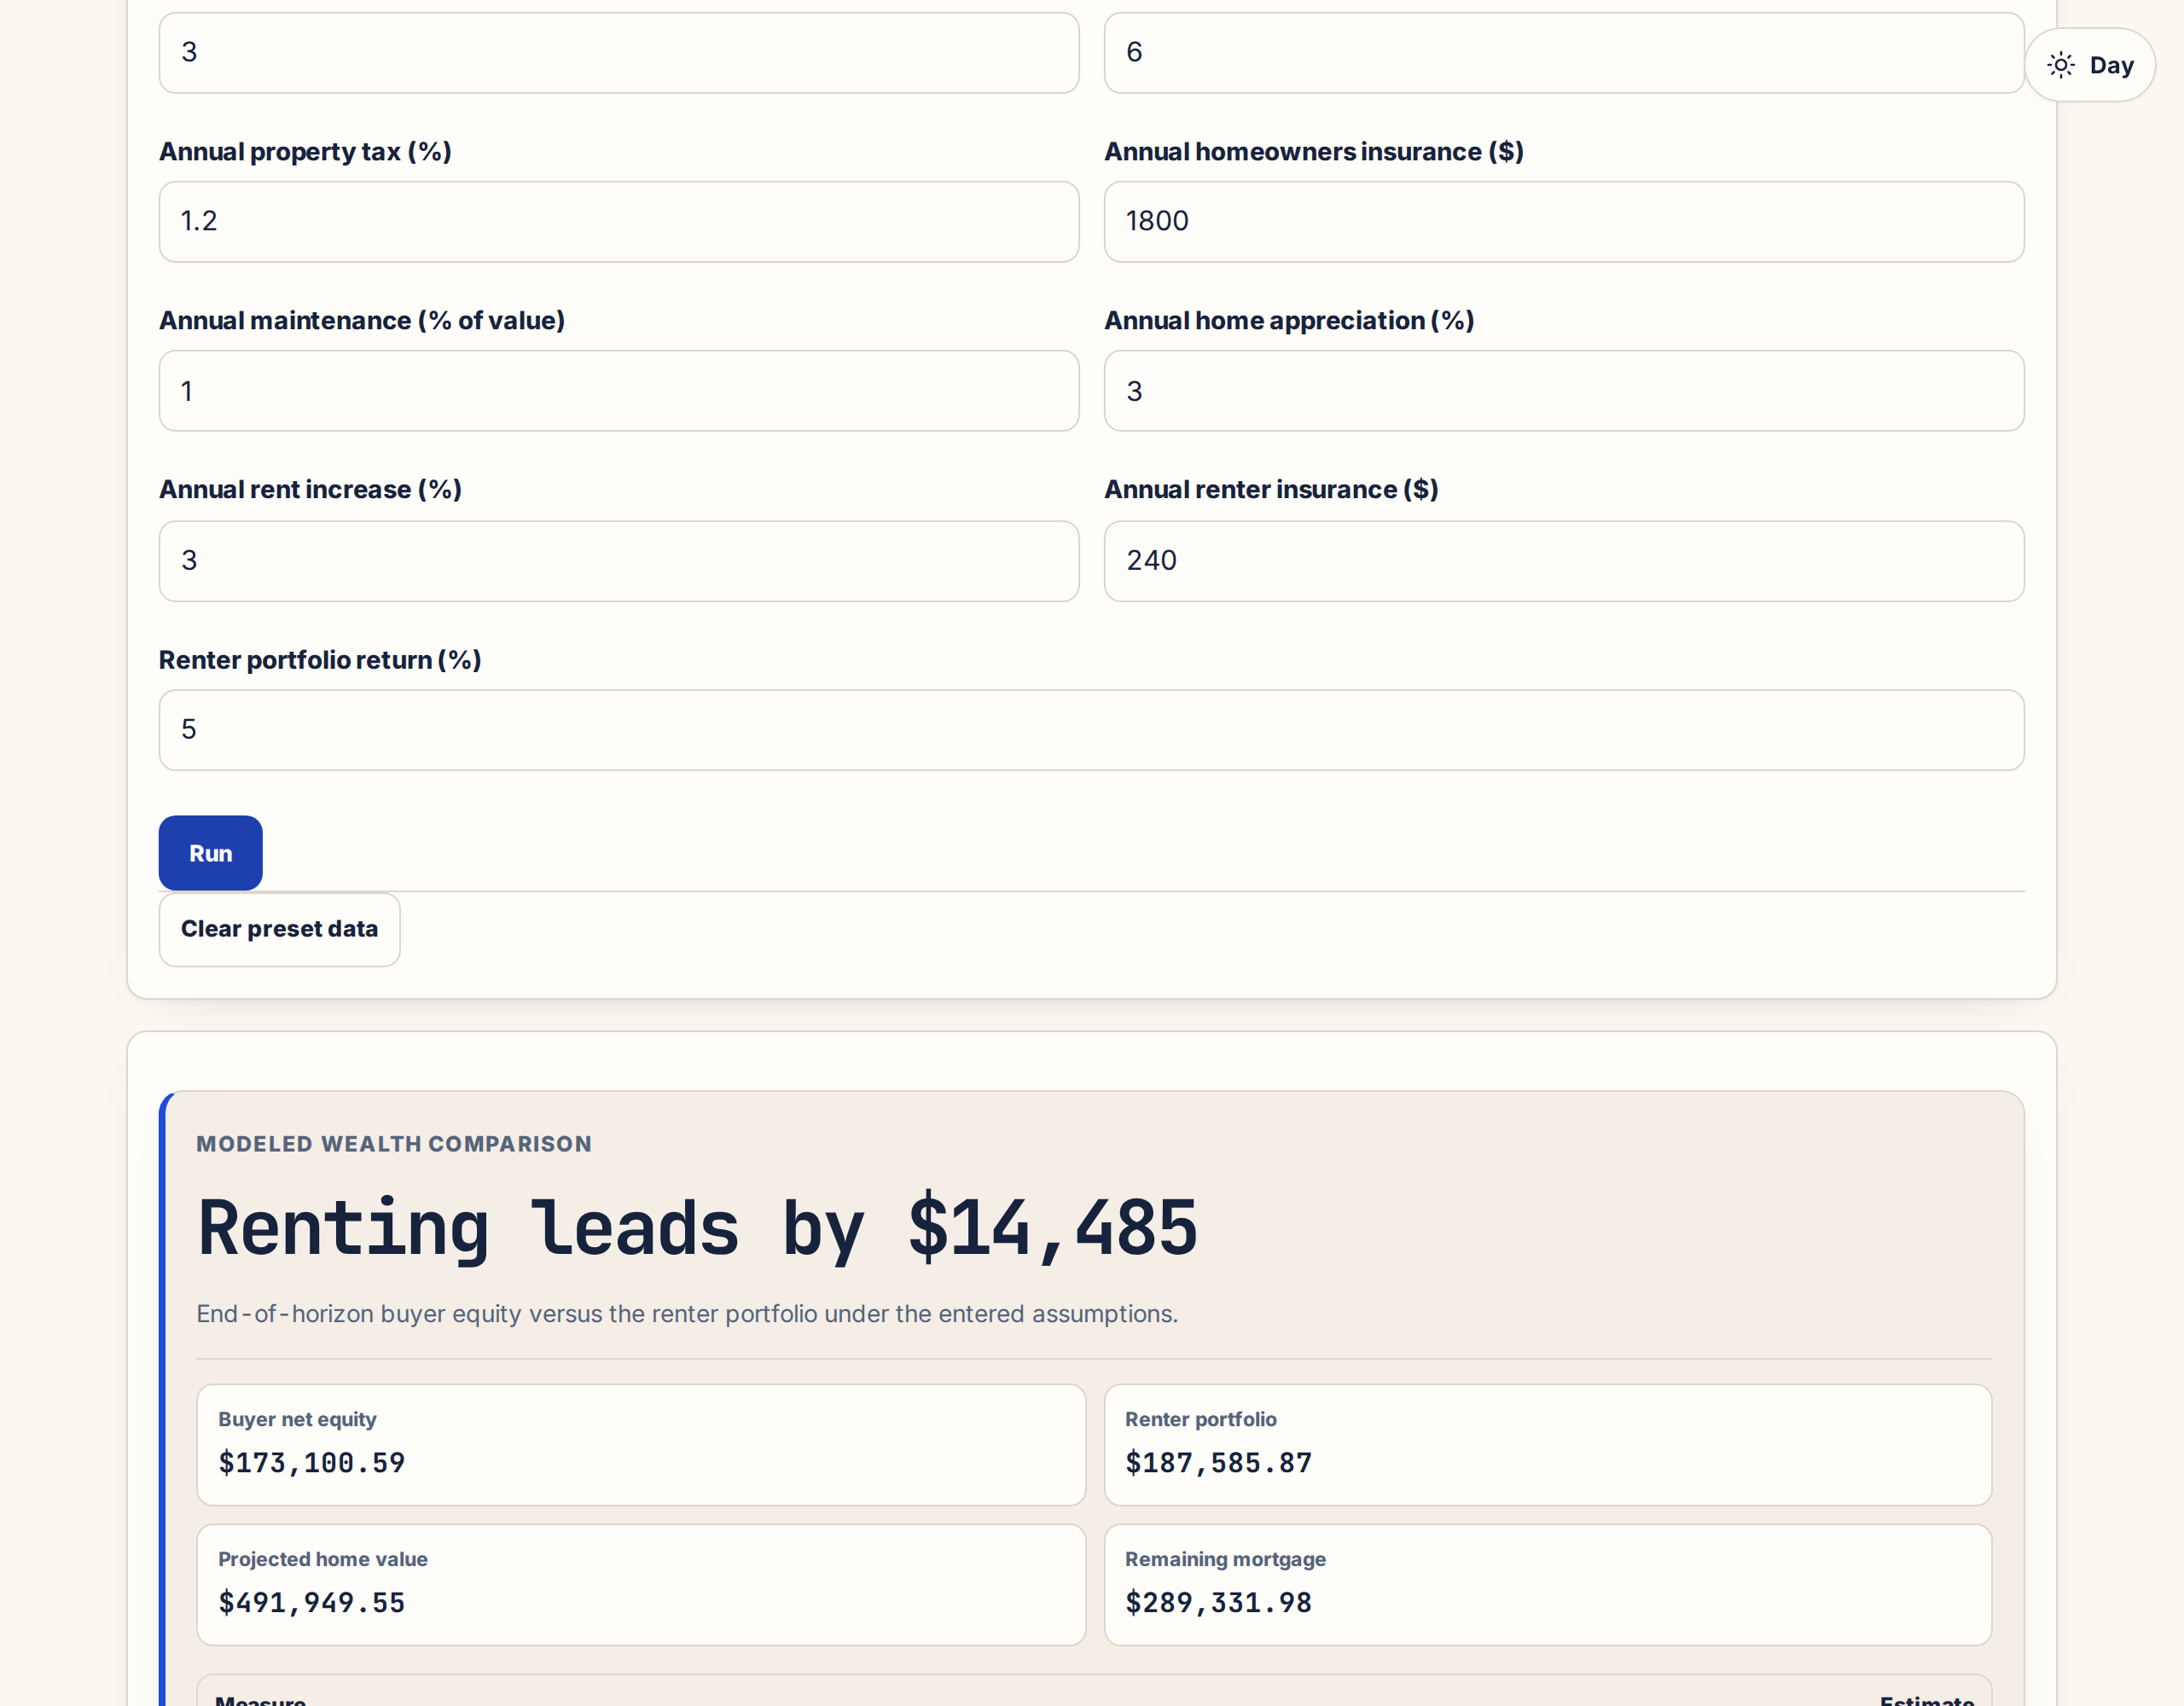
Using a $400,000 home, 20% down, 6.5% mortgage, seven-year horizon, $2,200 starting rent, and the displayed cost/growth assumptions, modeled buyer equity is about $173,101 versus a renter portfolio near $187,586, so renting leads by about $14,485.
Assumptions to verify
- Monthly cash-flow differences are invested or withdrawn from the renter portfolio at the entered return.
- Property tax and maintenance scale with modeled home value; insurance is entered separately.
- Tax deductions, investment volatility, moving costs, HOA, utilities, renovations, and local transaction details are excluded.
Frequently asked questions
Why compare wealth instead of only monthly cost?
The renter can invest the buyer’s upfront cash and monthly savings, while the buyer accumulates home equity; comparing only payments misses both effects.
Is the result a forecast?
No. Appreciation, investment returns, rent increases, maintenance, and transaction costs are assumptions that can change materially.
Does it include tax deductions?
No. Tax treatment is personal and jurisdiction-specific, so the calculator excludes deductions rather than assuming a benefit.
Cite this tool
BoringToolsKit. “Rent vs. Buy Calculator.” boringtoolskit.com/rent-vs-buy-calculator/ (reviewed July 2026). Free to reference in articles, syllabi, and answer posts with a link.
Privacy: Inputs and results stay in this browser. Any future sponsored recommendation or advertisement will be clearly labeled and kept separate from the calculation.